The foreign exchange market, or forex for short, is the world’s largest financial market. Understanding how to read forex charts is a crucial skill for any trader, regardless of experience level. This blog post equips you with the knowledge to decipher forex charts, identify trading opportunities, and navigate the dynamic currency market.
Chart Types: Unveiling the Language of Forex
Forex charts come in various forms, each offering a unique perspective on price movements. Here are some of the most common chart types:
- Line Charts: Simple and easy to read, line charts track the closing price of a currency pair over time.
- Bar Charts: Provide more information than line charts, with bars showing the opening, high, low, and closing prices for a specific timeframe.
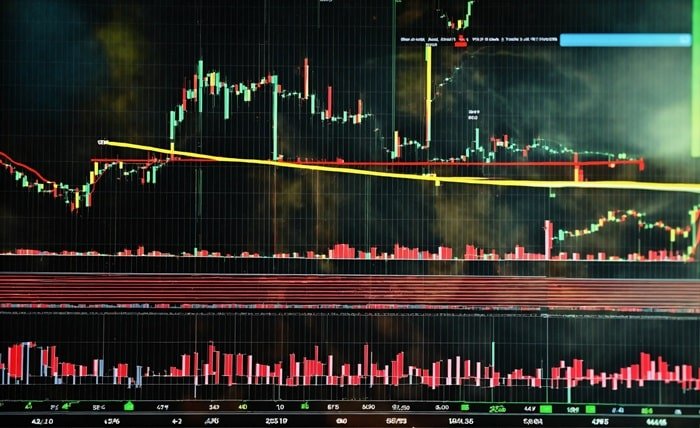
- Candlestick Charts: A popular choice, candlestick charts visually represent price movements with bars and wicks, offering a more detailed view of price action.
Anatomy of a Forex Chart: Understanding the Key Elements
Understanding the components of a forex chart empowers you to interpret the data effectively. Here’s a breakdown of key elements:
- Price Axis: Represents the exchange rate of the currency pair, typically displayed on the left side of the chart.
- Time Axis: Shows the timeframe of the chart, ranging from minutes to months.
- Bars/Candlesticks: Visually represent price movements within the chosen timeframe.
- Technical Indicators: Mathematical calculations are plotted on the chart to identify trends, support and resistance levels, and potential trading signals.
Beyond the Basics: Popular Technical Indicators Used in Forex Trading
Several technical indicators can enhance your analysis of forex charts. Some commonly used indicators include:
- Moving Average: Smooth out price fluctuations and help identify trends.
- Relative Strength Index (RSI): Measures the momentum of price movements and suggests potential overbought or oversold conditions.
- Bollinger Bands: Create a volatility channel around the price, potentially indicating areas of support and resistance.
Remember: Technical indicators should be used in conjunction with other analysis techniques and not solely relied upon for trading decisions.
Chart Patterns: Recognizing Opportunities in Price Movements
Forex charts often exhibit recurring patterns that can hint at future price movements. While not foolproof, identifying these patterns can be a valuable tool in your trading arsenal. Some common chart patterns include:
- Head and Shoulders: A potential reversal pattern indicating a potential trend change.
- Double Tops/Bottoms: Signals a possible pause or reversal in the current trend.
- Flags and Pennants: Continuation patterns suggest a brief consolidation before the trend resumes.
Practice Makes Perfect: Utilizing Demo Accounts to Hone Your Skills
Before risking real capital, familiarize yourself with forex charts and technical analysis. Many forex brokers offer demo accounts with virtual funds. Utilize these to practice reading charts, experiment with indicators, and develop your trading strategies.
Conclusion: Forex Charts – Your Key to Market Insights
Forex charts are a powerful tool for any forex trader. By understanding different chart types, key elements, technical indicators, and chart patterns, you can gain valuable insights into market movements and make informed trading decisions. Remember, consistent practice and a combination of technical and fundamental analysis are crucial for success in the forex market.
Frequently Asked Questions
Q: What is the best forex chart type?
A: There’s no single “best” chart type. The most suitable option depends on your trading style and preferences. Experiment with different types to see what works best for you.
Q: Are technical indicators reliable for predicting future price movements?
A: Technical indicators can provide valuable insights, but they are not perfect predictors of future prices. Use them in conjunction with other analysis techniques and manage risk effectively.
Q: How often should I update my forex charts?
A: The frequency depends on your trading style. Day traders might update charts constantly, while long-term investors may use longer timeframes.
Q: What are some resources to learn more about forex chart analysis?
A: Many forex brokers offer educational resources, and online courses and platforms can teach you technical analysis techniques.
Q: Is it possible to learn forex trading without any experience?
A: Yes, but dedication and education are crucial. Utilize demo accounts, educational resources, and practice consistently before risking real capital.